栗山くん(神)が作ったプログラムの使い方
1.DL
http://10.33.24.6/~kuriyama/bin/a2199lcnext.c
binの中にでも保存しておく
2.コンパイル
a2199lcnext.cをemacsで開いて
[Tools]→[Compile]を選択
下の小さいトコに
Compile command: gcc -o a2199lcnext a2199lcnext.c -lm
と入力してエンター
エラーがでなければコンパイル完了
3.準備
(フィル
ターがけ)
% evselect
table=P0116900501M1S007MIEVLI0000.FTZ:EVENTS withfilteredset=yes expression='(PATTERN <= 12)&&(PI in
[200:12000])&&#XMMEA_EM' filteredset=m1_filtered_200-12000.fits
filtertype=expression keepfilteroutput=yes updateexposure=yes
filterexposure=yes
フィルターがけした.fitsファイルのライトカーブをつくる
% evselect table=m1_filtered_200-12000.fits:EVENTS
withrateset=yes rateset=m1_Lc_filtered_200-12000.fits maketimecolumn=yes
timecolumn=TIME timebinsize=50 makeratecolumn=yes
このフィルターがけしたライトカーブじゃないとできないらしい(2013年12月現在)
こいつを一旦fvで開いて
% fv m1_Lc_filtered_200-12000.fits
RATEのAllをクリック
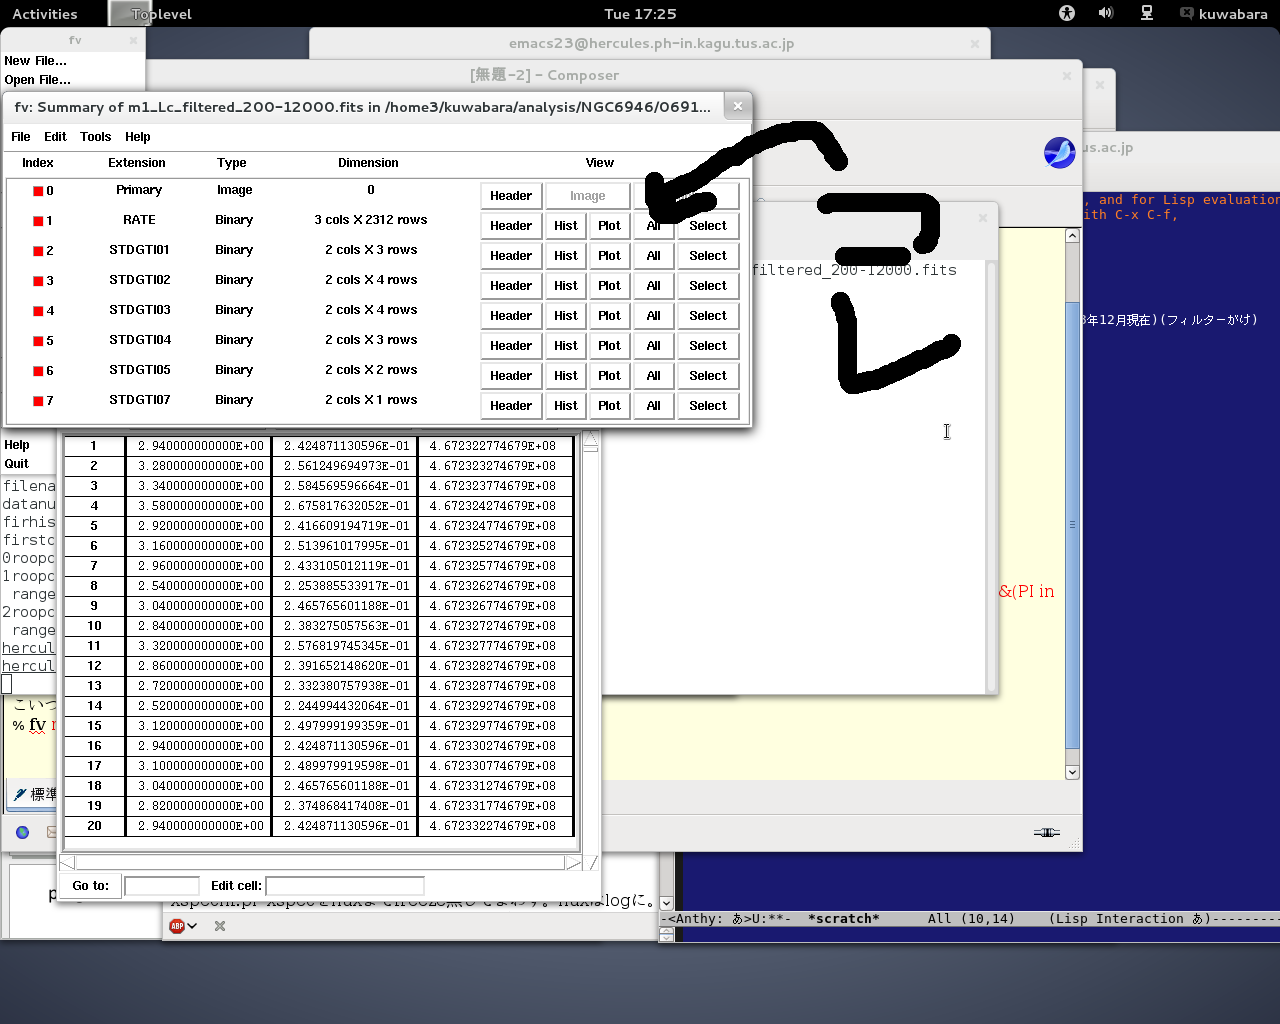
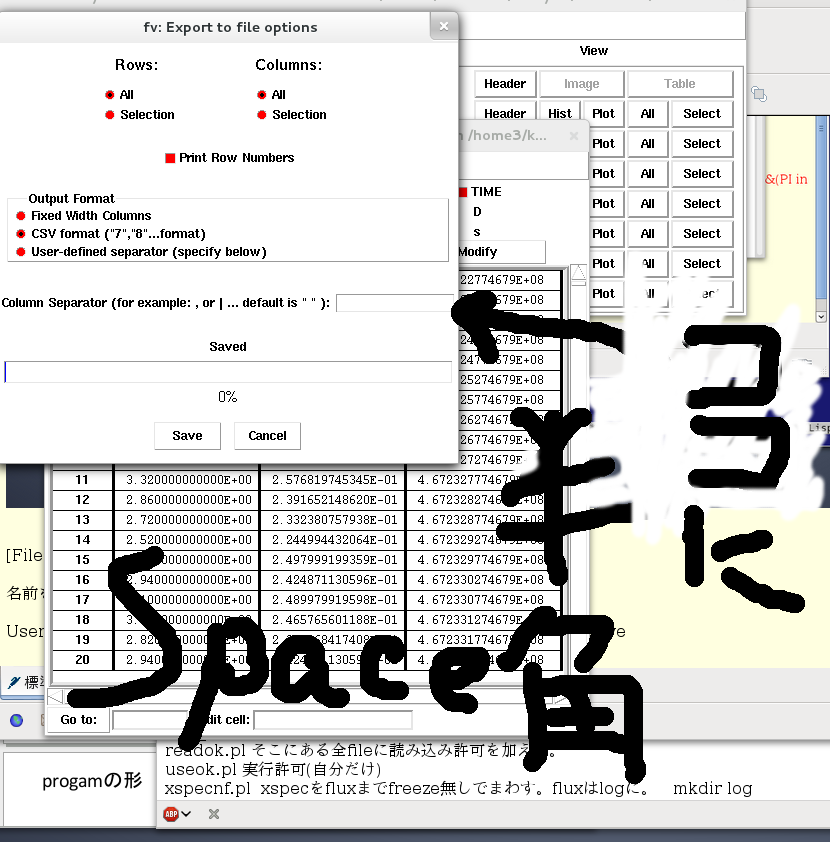
[File]→[Export as Text...]を選択
名前を決めてSave
User-defined separatorにチェックをいれて下の枠に半角スペースを入力してSave
4.実行
a2199lcnext とテキストファイルを同じディレクトリに入れる
実行
hercules:~/analysis/NGC6946/0691570101/work% ./a2199lcnext
filename=
テキストファイル名を入力
filename=m1_Lc_filtered_200-12000_t1.txt
datanum=2312
firhismax=1.679400
ちょっと待つ
hercules:~/analysis/NGC6946/0691570101/work% ./a2199lcnext
filename=m1_Lc_filtered_200-12000_t1.txt
datanum=2312
firhismax=1.679400
firstcutnum=1982
0roopcut num=1982 sig=0.210975 mean=1.644349
1roopcut num=1957 sig=0.210975 mean=1.644349
range=1.095814~2.192884
2roopcut num=1945 sig=0.194661 mean=1.637271
range=1.131153~2.143389
これらの数字の意味は本人が解説してく
れているのでそちらを
gnuplotのグラフが2つできる(古いPCだとgnuplot自体が壊れている?)
datファイルが3つできる
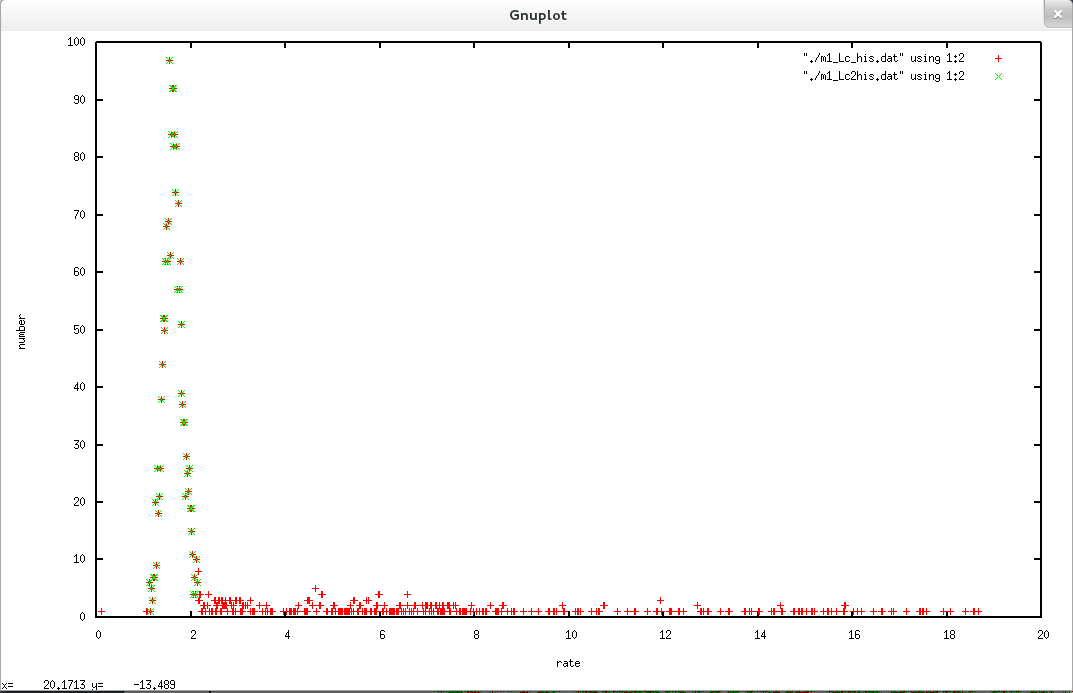
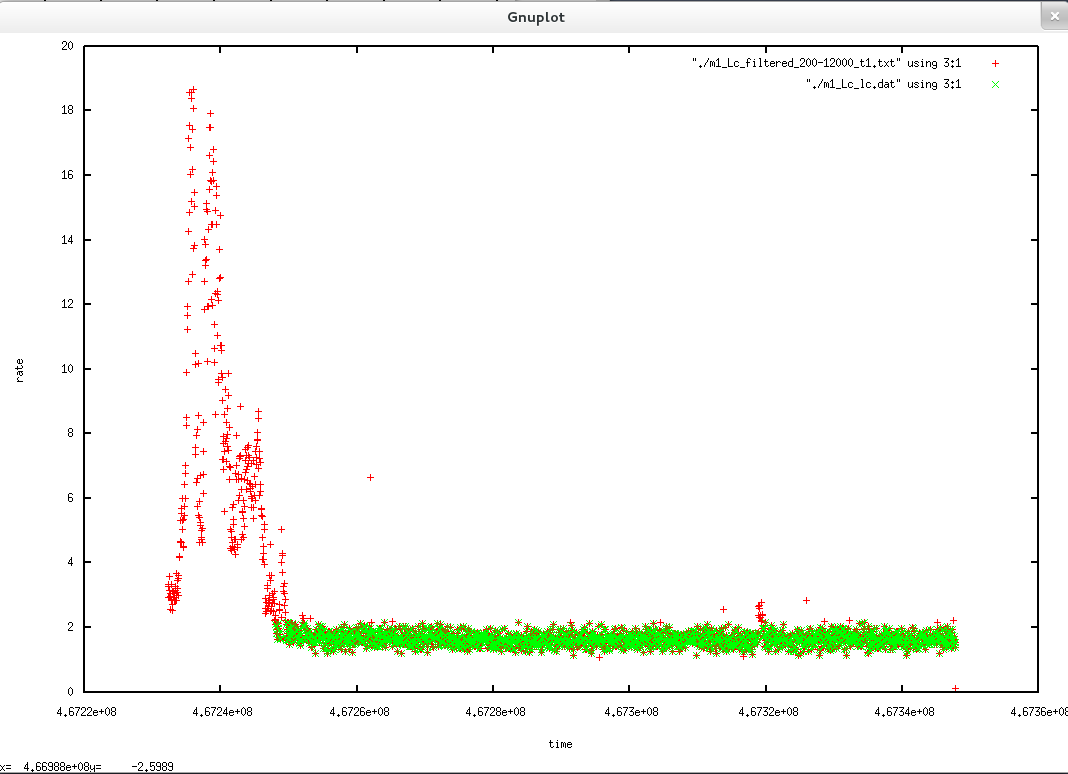
左がヒストグラム 右がカットした範囲(赤がカットした点)
最終的に1.131153~2.143389以外の点をカットしたってことでいいんすかね